
Every two years or so, a European retail buyer comes to us with the same situation. They launched a private label cordless tool line three years ago. They negotiated hard on unit price with their original factory. They saved €4 per unit versus the next-best quote. By every standard procurement metric, they won the negotiation.
Now they’re shopping for a new supplier.
When I ask why, the answer is always some version of the same story: warranty claims ran higher than expected. Customer service costs scaled faster than revenue. A bad review cycle on Amazon eroded their conversion rate. Their original factory couldn’t develop the new SKU they needed, so they had to source it elsewhere — and now they’re supporting two different battery platforms. The line that looked profitable in the spreadsheet is barely breaking even in the P&L.
The unit price was real. The savings were real. The total cost of ownership was something nobody calculated.
This article is about what TCO actually looks like over the life of a private label power tool line — not the first 90 days after the first container arrives, but the 36 months that determine whether the line builds a brand or quietly bleeds margin. After fifteen years of running export business from a cordless tool factory in Wuxi, I’ve seen this cycle repeat enough times to know where the real costs live. They are not where the procurement spreadsheets look.
Why Unit Price Comparison Is Fundamentally Misleading
The standard approach to evaluating OEM suppliers goes something like this: gather quotes from five factories, compare unit prices, evaluate the spread, pick the lowest one that meets your quality requirements. Negotiate further. Ship. Repeat.
This approach is built on a hidden assumption: that the unit price is the dominant variable in the cost equation, and that other costs are roughly similar across suppliers. They aren’t.
Here’s what the procurement spreadsheet typically captures:
- Unit FOB price
- Tooling investment (amortized across expected volume)
- Freight and import duty
- Certification fees (amortized)
- Pre-shipment inspection cost
- Payment terms impact on cash flow
These are the visible costs. They are also the costs where most factories are roughly comparable — within 5-15% of each other, with the spread driven mostly by component sourcing and overhead efficiency.
Here’s what the spreadsheet almost never captures:
- Year-on-year defect rate trajectory (does the factory’s quality hold or drift?)
- Customer service cost scaling (does it grow linearly with sales or exponentially with negative reviews?)
- Battery platform extension cost (can you add a new SKU to the same platform, or do you have to redesign?)
- Brand reputation cost from one viral negative review
- The cost of a forced supplier switch mid-line
- Inventory carrying cost from MOQ mismatches
- The cost of the second container when the first one underperforms
These costs are not visible in the procurement stage. They emerge over the 24-36 months following launch. And here’s the painful part: they almost always favor the supplier who appeared more expensive on unit price.
The Four Cost Categories Retailers Don’t Model
Let me break down each of these hidden cost categories with the kind of specifics that actually matter when you’re running the line.
Cost Category 1: Quality Drift Over Time (Year 1 vs. Year 2 vs. Year 3)
When you place your first order with a new factory, you’re getting their best work. They’ve just won your business. The sample was excellent. The first container is built with care because they want the second order.
But power tool manufacturing has a quality drift problem that very few factories talk about. As production volumes stabilize, cost pressures emerge, component suppliers change, and operators rotate. The factory that built your first container at 4% defect rate might be building your fifth container at 8% defect rate — and you won’t know until the warranty claims start landing.
Here’s why this matters in TCO terms:
- Year 1 defect rate at 4%: warranty cost ≈ $1.50-2.00 per unit
- Year 2 defect rate at 6%: warranty cost ≈ $2.25-3.00 per unit
- Year 3 defect rate at 9%: warranty cost ≈ $3.40-4.50 per unit
A 5% drift in defect rate over 18 months can add $2-3 per unit in warranty cost — wiping out the €4 unit savings that originally drove the supplier choice.
The factories that don’t drift are the ones with documented quality systems: incoming inspection records, in-process quality data, field failure tracking, and engineering review processes. The factories that drift are the ones that don’t. You can verify which kind you’re working with before you commit — most buyers don’t.
Cost Category 2: Customer Service Scaling (Linear vs. Exponential)
Customer service cost is often modeled as a linear function: 1,000 units sold = X support hours. This is wrong for power tools.
Power tool customer service cost scales exponentially once you cross a certain defect rate threshold. The reason is review-driven. A product line with a 3% defect rate generates occasional support tickets but few enough that buyers leave mostly positive reviews. A product line with an 8% defect rate generates enough negative reviews to:
- Lower the product’s star rating below 4.2, at which point conversion rate starts to drop measurably (Amazon data suggests products under 4.2 stars convert 18-25% worse than products above 4.4).
- Trigger comparison shopping, where prospective buyers read the negative reviews and either choose a competitor or contact your customer service pre-purchase with questions.
- Generate social media complaints, which require response and damage control, which is more expensive than handling returns.
- Attract regulator attention if the issue involves safety (battery fires, electrical faults), at which point you’re dealing with a recall process — not a customer service issue.
So the cost curve looks something like this:
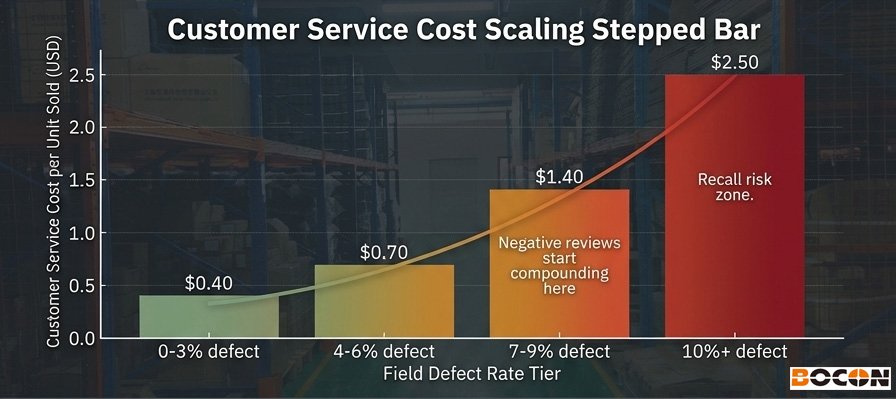
- 0-3% defect rate: customer service cost scales roughly linearly with volume (~$0.40/unit)
- 4-6% defect rate: customer service cost scales 1.5x linearly (~$0.60-0.80/unit)
- 7-10% defect rate: customer service cost scales 2.5-3x linearly ($1.20-1.50/unit) plus brand damage
- 10%+ defect rate: you’re in recall territory, cost structure breaks entirely
The factory that gave you a $4 unit saving by using Grade B cells has put you on the steep part of this curve. By Year 2, the customer service cost differential alone can exceed the original unit saving.
Cost Category 3: Battery Platform Lock-In and Extension Cost
This is the cost category that almost no retailer models at all — and it’s the one I’ve seen cause the most expensive problems.
When you launch a cordless tool line, you choose a battery platform: 18V, 20V MAX, or 40V (for outdoor equipment). You commit to this platform because every SKU in your line needs to share batteries with every other SKU. Once you’ve sold the first 1,000 units with batteries, you cannot change the platform without orphaning your existing customers.
This creates two costs that emerge over 24-36 months:
The SKU extension cost. Your line launches with a drill and an impact driver. Two years in, you want to add a circular saw, an angle grinder, and an oscillating tool. If your factory can develop these tools on your existing platform, the cost is moderate — design engineering, tooling, certification. If your factory cannot develop them, you have two choices: source the new SKUs from a different factory (which means a different battery platform, fragmenting your line) or redesign your entire line on a new platform (which means orphaning your customers and starting over).
I’ve worked with retailers who came to us in this exact situation. They had committed to a factory for the first two SKUs, and when they needed to expand, that factory didn’t have the engineering capability to develop the new tools. They had to either restrict their line to what the original factory could build, or fragment the line across multiple suppliers. Both options are expensive — and neither was visible at the original procurement stage.
The platform obsolescence cost. Battery technology evolves. The cell format you chose in Year 1 may be discontinued by the cell manufacturer in Year 3. If your factory has only one cell supplier, you’re exposed. If your factory has multiple qualified cell suppliers, you’re protected.
At Bocon, we maintain 35+ certified backup suppliers for core components specifically because of this risk. We’ve had clients who came to us after their original factory had to stop production mid-contract because their only cell supplier changed their product line. That kind of supply chain break can cost a retailer a full season of sales.
Cost Category 4: Brand Reputation and the Long Tail of Negative Reviews
The most underestimated cost in private label power tool TCO is brand reputation. Not because retailers don’t know reputation matters — they do — but because the cost shows up in places that are hard to attribute.
Here’s how reputation cost accumulates:
Search ranking impact. Products with sub-4.0 star ratings on Amazon typically don’t appear on the first page of search results for their category. A drop from page 1 to page 2 can reduce organic traffic by 60-80% — which means you have to spend more on advertising to drive the same volume.
Retail partner delisting. Major retail chains have minimum quality thresholds for their private label products. If your defect rate exceeds their threshold, they may delist the product — at which point you have inventory you cannot sell through your primary channel.
Customer acquisition cost inflation. A brand with strong reviews acquires new customers cheaply. A brand with mixed reviews has to discount more heavily, run more promotions, and spend more on marketing to acquire each customer. Over 24 months, this compounds significantly.
Repurchase rate erosion. For cordless tools, the most valuable customer is the one who buys your drill and then comes back for your impact driver, your circular saw, and your angle grinder. A customer who had a bad experience with the first tool doesn’t come back. The lifetime value of that customer — which should have been 3-4x the initial purchase — is gone.
A conservative estimate puts the brand reputation cost of a sustained quality problem at $3-7 per unit over the life of the line. That’s $3-7 per unit that doesn’t appear anywhere in the procurement spreadsheet.
The Real TCO Formula: A Five-Year View
Here’s the TCO framework I walk retail buyers through when they’re evaluating suppliers. It’s not the first-year cost breakdown — that’s the easy part. This is the multi-year view that actually predicts whether the line will be profitable.
Year 1 TCO (per unit sold):
| Cost Category | Low-Quality Supplier | High-Quality Supplier |
|---|---|---|
| Unit FOB | $34 | $38 |
| Freight + duty | $9 | $9 |
| Certification amortization | $1.80 | $1.20 |
| Pre-shipment inspection | $0.40 | $0.30 |
| Warranty fulfillment (4% vs 8% defect rate) | $3.20 | $1.50 |
| Return processing | $1.20 | $0.60 |
| Customer service | $1.10 | $0.45 |
| Year 1 TCO per unit | $50.70 | $51.05 |
The high-quality supplier costs $0.35 more per unit in Year 1. Almost identical. This is why unit price comparison looks like a sensible basis for decision — in Year 1, the savings look real.
Year 2 TCO (per unit sold):
Now factor in the quality drift and brand effects that emerge in Year 2:
| Cost Category | Low-Quality Supplier | High-Quality Supplier |
|---|---|---|
| Unit FOB | $34 | $38 |
| Freight + duty | $9 | $9 |
| Certification amortization | $1.80 | $1.20 |
| Pre-shipment inspection | $0.40 | $0.30 |
| Warranty fulfillment (drift to 7% vs 4%) | $4.20 | $1.55 |
| Return processing | $1.80 | $0.65 |
| Customer service (negative reviews piling up) | $1.80 | $0.50 |
| Brand reputation cost (search, conversion) | $1.50 | $0.20 |
| Year 2 TCO per unit | $54.50 | $51.40 |
Now the high-quality supplier is $3.10 cheaper per unit. The $4 savings from Year 1 has become a $3 loss.
Year 3 TCO (per unit sold):
In Year 3, the full costs of supplier mismatch emerge:
| Cost Category | Low-Quality Supplier | High-Quality Supplier |
|---|---|---|
| Unit FOB | $34 | $38 |
| Freight + duty | $9 | $9 |
| Certification amortization | $1.80 | $1.20 |
| Pre-shipment inspection | $0.40 | $0.30 |
| Warranty fulfillment (drift to 10% vs 4%) | $5.50 | $1.60 |
| Return processing | $2.50 | $0.70 |
| Customer service (exponential) | $2.80 | $0.55 |
| Brand reputation cost (compounding) | $3.50 | $0.30 |
| Platform extension cost (amortized) | $1.80 | $0.20 |
| Forced supplier switch risk (amortized) | $1.20 | $0 |
| Year 3 TCO per unit | $62.50 | $51.85 |
By Year 3, the high-quality supplier is $10.65 cheaper per unit. The retailer who chose the cheap supplier in Year 1 has paid $12 per unit more in cumulative hidden costs than they saved on unit price. Across 5,000 units, that’s $60,000 in lost margin — and likely a damaged brand relationship that costs more to rebuild than the original savings were worth.
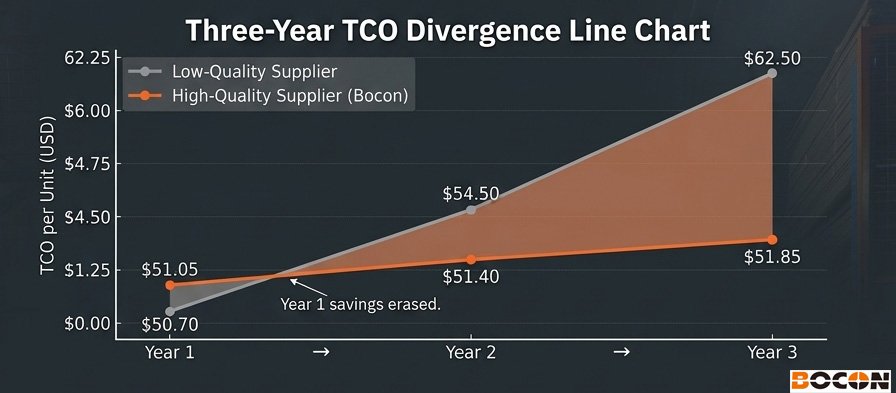
This is the calculation that should drive supplier selection. Almost no retailer runs it.
After-Sales Cost Calculation: A Framework You Can Use
Here’s a practical framework for calculating after-sales cost that you can use during supplier evaluation. It’s the framework I walk buyers through when they ask us to quote — because the calculation should be the same regardless of which factory they ultimately choose.
Step 1: Estimate defect rate at scale
Ask the factory for their field failure data (not their defect rate from internal QC — that’s almost always optimistic). If they can’t provide field failure data, assume 6-8% as a baseline. If they can, verify the data covers at least 12 months and includes field returns, not just production-line rejects.
Step 2: Calculate warranty cost per unit
Formula: (defect rate × average cost per claim)
Average cost per claim includes: replacement unit cost, shipping both ways, customer service time, processing overhead. For cordless tools, this typically runs $25-50 per claim depending on product category and warranty terms.
For a factory with 4% field defect rate and $30 average claim cost: warranty cost = 0.04 × $30 = $1.20/unit.
For a factory with 8% field defect rate: warranty cost = 0.08 × $30 = $2.40/unit.
Step 3: Calculate customer service cost per unit
This is harder to estimate without internal data, but a reasonable framework: customer service cost scales with defect rate, but with a step-function increase above 6% defect rate (where negative reviews start to compound).
- 0-3% defect rate: $0.40/unit
- 4-6% defect rate: $0.70/unit
- 7-9% defect rate: $1.40/unit
- 10%+ defect rate: $2.50/unit plus brand damage
Step 4: Calculate brand reputation cost per unit
This is the hardest to estimate, but use the following proxy:
- For products with average rating above 4.4 stars: $0.20/unit
- For products with average rating 4.0-4.4: $1.50/unit (advertising cost to compensate for organic traffic loss)
- For products with average rating below 4.0: $4.00/unit plus delisting risk
Step 5: Add platform extension risk
If your factory can develop new SKUs on your existing battery platform: $0.20/unit amortized over the life of the line.
If your factory cannot develop new SKUs and you’ll need to source elsewhere: $1.50-2.00/unit amortized (factoring in the cost of managing multiple suppliers, fragmented inventory, and customer confusion).
Step 6: Sum and project over 3 years
Add all the above to your Year 1 landed cost. Project the trajectory — defect rates typically drift, customer service costs scale, brand reputation compounds. The Year 3 number is the one that matters most.
A Real-World Case: What This Looks Like in Practice
A few years ago, a European retail buyer came to us after their original supplier relationship had broken down. The story is instructive because it’s typical.
They had launched a private label cordless drill line three years earlier. The original factory had quoted $36/unit FOB — $4 cheaper than the next-best quote. The buyer had negotiated hard on this basis and felt they had won.
By the time they came to us, here’s what had happened:
Year 1: Defect rate came in at 5% — higher than the 3% the factory had quoted. Warranty costs were absorbed as a learning curve. The line was profitable.
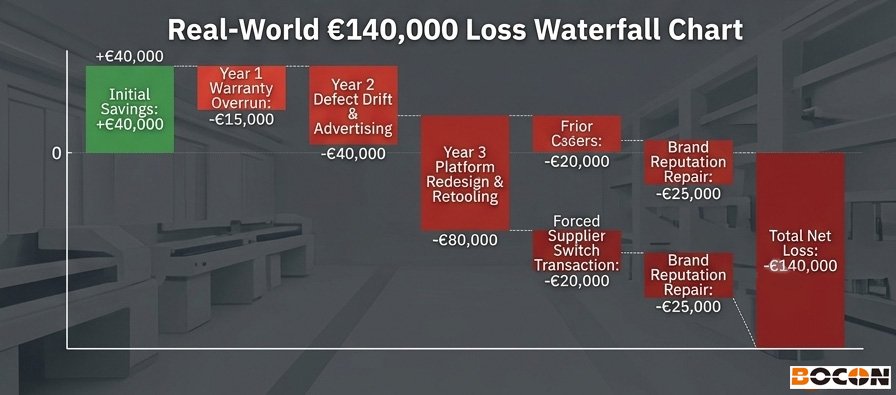
Year 2: The factory’s defect rate drifted to 8%. Customer service costs scaled. The product’s Amazon rating dropped from 4.3 to 3.9. Conversion rate fell by approximately 20%. The buyer had to spend €40,000 on additional advertising to maintain sales volume.
Year 3: The buyer wanted to add a circular saw and angle grinder to the line. The original factory couldn’t develop them on the existing platform — they didn’t have the engineering capability. The buyer had to either redesign the entire line on a new platform or restrict their expansion plans. They chose to redesign, which orphaned 2,000 existing customers and required retooling that cost €80,000.
By the time they switched to us, they had spent approximately €180,000 in cumulative costs that weren’t in the original procurement spreadsheet — against €40,000 in unit price savings over three years. The net loss was €140,000, plus the brand damage of three years of mixed reviews.
This is the math that nobody does at the procurement stage. And it’s the math that determines whether a private label line builds a brand or quietly fails.
How Bocon Approaches TCO Differently
I’ve spent most of this article talking about what goes wrong. Here’s what we do at Bocon to prevent these problems — not as a sales pitch, but as a description of what a supplier relationship that minimizes TCO actually looks like.
We track field failure data and share it with partners. Our field failure rate is tracked by component — battery, motor, gearbox, BMS — across our entire client base. We share this data with retail partners so they can model warranty costs accurately.
We maintain 35+ certified backup suppliers for core components. This protects against supply chain disruptions that would force a retailer into emergency reorders or platform changes. We’ve never had to stop production because of a single supplier failure.
Our BMS firmware is developed in-house. This means we can extend the battery platform with new SKUs without redesigning the BMS — protecting the retailer’s platform investment.
We develop new SKUs on existing platforms. Our engineering team can build new tool types on a customer’s existing battery platform. This is the single biggest TCO protection we offer retail partners — the ability to extend the line without fragmentation.
We maintain consistent quality over time. Our quality system doesn’t allow for the kind of drift that creates Year 2 and Year 3 cost escalation. Our defect rate has been stable at under 4% for years, not because we got lucky, but because our process is documented and enforced.
If you’re evaluating suppliers for a private label power tool line and want to discuss how this plays out in your specific situation, contact us at www.oemcordlesstools.com or shawn@oemcordlesstools.com. We don’t do high-pressure sales — we do engineering conversations about how to keep your line profitable over five years, not just the first container.